 This reflects "the growing affordability hurdles renters face," says analyst.
The average American would need to work around 63 hours to afford the typical monthly rent of $2,040, according to new analysis by Zillow. The report, penned by senior economist Jeff Tucker, revealed this is six hours more than what renters needed to work before the pandemic in October 2019. “These figures illustrate the growing affordability hurdles renters face, even amid what has been a strong labor market,” said Tucker, pointing to how rents have increased 36.9% over the last five years, while the average hourly wage grew only 23% during the same period. Sun Belt renters struggle the most with affordability Miami was found to have the biggest affordability hurdles for renters, with the average worker needing to work 96 hours to pay for rent. This is 24 hours more than the time that renters needed to work five years ago, marking the largest gap among 50 of the largest metros in the US. Renters faced similar challenges in other metros within the Sun Belt, a region that experienced a housing boom during the pandemic. In Tampa, the average worker would need an extra 20 hours of work to afford rent compared to five years ago. Meanwhile, renters in Phoenix would need to work 17 hours more to cover rent, with rents growing 66.7% since 2017. In other Sun Belt areas, the hours of work needed to afford rent stayed below the national average of 63 hours. These metros included Atlanta, where renters need work of 61 hours to cover rent, as well as Phoenix (61 hours), Nashville (60 hours) and Austin (58 hours). Out of the 50 metros included in the Zillow analysis, only San Jose, Boston and San Francisco saw rents becoming easier to pay over the past five years. These markets are also among the most expensive in the country where rents have grown slower than average, allowing wages to catch up. Rent growth ends two-year streak In October, the typical monthly rent finally eased after two years of growth with a 0.1% month-over-month downturn. Annual rent growth reached a record high of 17.1% back in February, which has since slowed to 9.6% year-over-year. “The rental market has cooled this year, but so far that has meant prices growing more slowly, not any real relief for renters,” said Tucker. “Rents were growing at a record pace for much of 2021, squeezing budgets for renters moving or renewing leases. Now, it appears more people are opting to double up with roommates or family, which means more vacancies and pressure on landlords to price their units competitively, offering some hope of relief on the horizon. ents fell last month for the first time in two years, possibly the start of more price drops to come, or at least a signal that we are back to the usual seasonal rhythms of the rental market.”
0 Comments
  Black Knight provides a sneak peek into the latest data.
Prepayments across the US dropped to the lowest rate recorded since at least 2000, new data has revealed, while the mortgage delinquency rate continued its upward climb by another 4.5% in October. Data analytics company Black Knight has provided a sneak peek into October’s mortgage performance statistics before its in-depth report becomes available online later this year. The preview shows the lowest recorded prepayment activity since Black Knight began tracking the metric in 2000, a single-month mortality rate of 0.48% in October. This prepayment rate was 16.5% lower than the 0.55% recorded from the previous month. At the same time, Black Knight’s numbers showed the first signs of the aftermath from Hurricane Ian, with the national delinquency rate shooting up from September to 2.91% in October and Florida topping the list of most new early delinquencies (+19,000) with a delinquency rate of 3.42%. This was a 53-basis point increase for the state coming from the previous month. Loans 60 days past due also rose by 2.9% across the country, while loans at least 90 days past due dipped by 1.5% from September to October. October also saw servicers initiating foreclosure starts on 4% of existing, serious delinquencies, bringing the total number of foreclosure starts to 19,600 nationally. The numbers were an improvement from September’s data but still only half the rate recorded in pre-pandemic years, Black Knight said. The low foreclosure start numbers, which the company described as ‘historically low’, kept the active foreclosure inventory ‘subdued’ but steady. The number of properties in foreclosure pre-sale inventory rose by 1,000 to 186,000 in October, while properties 30 or more days past due or in foreclosure rose by 66,000 to 1,743,000.  All four major regions registered yearly and monthly slumps.
Existing-home sales dropped for the ninth month in a row according to the National Association of Realtors (NAR). Total existing-home sales – including completed sales for single-family homes, condominiums, townhomes, and co-ops – decreased to a seasonally adjusted annual rate of 4.43 million in October. This represented a 5.9% decrease from the previous month and a 28.4% dive from the 6.19 million recorded the same month last year. All major regions across the US registered monthly and yearly declines. Properties remained on the market for an average of 21 days, up from 19 days in September and 18 days in the same month last year. Sixty-four per cent (64%) of homes sold in October were on the market for less than a month. The inventory of unsold existing homes at the end of October was 1.22 million units – the equivalent of 3.3 months’ supply at the current monthly sale pace – down for a third consecutive month. “More potential homebuyers were squeezed out from qualifying for a mortgage in October as mortgage rates climbed higher,” said NAR chief economist Lawrence Yun, who noted that the impact of recent mortgage rate hikes was more apparent in expensive areas of the US and in markets with significant home-price gains in recent years. “Inventory levels are still tight, which is why some homes for sale are still receiving multiple offers,” Yun said. “In October, 24% of homes received over the asking price. Conversely, homes sitting on the market for more than 120 days saw prices reduced by an average of 15.8%.” Existing-home prices rose across all regions, with the median existing-home price across all housing types at $379,100, up 6.6% from the year before. NAR noted that this was the 128th consecutive month of year-over-year increases – the longest-running streak on record. The largest yearly median list price growth occurred in Milwaukee, Miami, and Kansas City, while the highest increases in the share of homes with year-on-year price reductions occurred in Phoenix, Austin, and Las Vegas. “Mortgage rates have come down since peaking in mid-November, so home sales may be close to reaching the bottom in the current housing cycle,” Yun said. First-time buyers were responsible for 28% of sales in October, down from 29% in September 2022 and October 2021. All-cash sales accounted for 26% of transactions, up from 22% in September and 24% in October 2021. For single-family homes, sale numbers declined to a seasonally adjusted annual rate of 3.95 million, down 6.4% from September and 28.2% from October 2021. The median existing single-family home price was $384,900, increasing by 6.2% year-on-year. Existing condominium and co-op sales were recorded at a seasonally adjusted annual rate of 480,000 units, down 2% from September and 30% from October last year. The median existing condominium price was $331,000, a 10% increase from September’s median price. “For consumers looking to buy or sell a home, having a realtor by their side to navigate one of the more challenging and complex markets we’ve seen in some time will be essential to successfully completing transactions,” said NAR president Kenny Parcell. “Realtors understand local market conditions and provide timely and trusted advice from listing to closing.”  "First-time buyers are really struggling in today's market".
Sales of previously occupied homes fell once again in October as steep home prices continued to hurt affordability and keep first-time buyers on the sidelines. Citing data from the National Association of Realtors (NAR), the Associated Press reported that existing home sales fell to a seasonally adjusted annual rate of 4.43 million last month. This is 5.9% below September and 28.4% down from October of the previous year. October’s fall in sales marked this year’s ninth consecutive month of decline, the longest on record since 1999. Sales have also dropped to the slowest annual pace since December 2011, excluding the slowdown that occurred around the start of the COVID-19 pandemic in May 2020. Amid this slowdown, home prices have continued to climb, with the national median rising 6.6% to $379,100 from a year earlier. While this is 8% below the peak recorded last June, it is still 40% above October 2019. “That’s really hurting affordability,” NAR chief economist Lawrence Yun told the Associated Press. “Most household incomes have not risen by 40%.” Inventory has likewise shrunk for the third consecutive month, according to the NAR’s data, with 1.22 million homes listed for sale by the end of October. This is 0.8% below September levels and equates to a supply of 3.3 months at current pace. One reason for the drop in the number of homes listed for sale is rising mortgage rates, the Associated Press said, as homeowners who were able to lock in record-low rates from the last couple of years delay the purchase of a new home. With listings down, homes sold within an average 21 days, up from 19 days in September. By contrast, homes typically sold after more than 30 days pre-pandemic. “First-time buyers are really struggling in today’s market,” said Yun, pointing to data which showed that first-time buyers accounted for only 28% of sales in October, falling slightly from the 29% reported in September. Based on historical standards, first-time buyers typically accounted for as much as 40% of transactions in the market, according to the Associated Press.  Only small increase prevented "across-the-board" contraction, report says.
Mortgage lending in the US slumped during the third quarter by 47% year on year, representing the biggest annual drop in 21 years, according to a new report by real estate data provider, ATTOM. Data shows that it was also the sixth quarterly decrease in a row and down by 19% compared to Q2 this year, a measure of the detrimental impact of high interest rates on the US mortgage sector, which now top 7%. Both refinance and purchase loan activity also experienced a double-digit drop “that far outweighed another increase in home-equity credit lines”, the report added. Refinance loan activity slumped by 68% compared to the same period in 2021 and by 31% from the second quarter this year (the lowest since early 2019), while the number of purchase loans fell by 33% year on year and by 16% quarterly, representing half of all mortgage activity during Q3. Refinance activity now represents only a third of overall mortgages, compared to two-thirds as recently as the first quarter of last year, ATTOM noted. Purchase lending continued at just under half of all activity in Q3, while home-equity packages made up one out of every five mortgage deals completed. To compile the data, ATTOM analyzed recorded mortgage and deed of trust figures for single-family homes, condos, town homes and multi-family properties of two to four units. Dollar volume was calculated by multiplying the total number of loan originations by the average loan amount for those loan originations. In total, lenders issued $636.5 billion worth of mortgages during Q3. It was also the biggest annual decrease in the dollar volume of mortgages since at least 2001. The report went on to say it was “the latest sign that the 11-year US housing market boom is losing steam”. Rick Sharga, executive vice president of market intelligence at ATTOM, said the figures came as no surprise, due to “the unprecedented jump in mortgage rates” that had “battered” both the purchase and refinance markets. “Prospective homebuyers have been priced out of the market…and refinance activity will probably continue to decline, since the majority of homeowners have loans with sub-4% interest rates,” he said. Bank lending The number of residential mortgages issued by banks and other lenders also took a hit in Q3, as they were down by a staggering 46.9% year on year, from the 3.7 million that were issued during the same period in 2021 to 1.9 million. They also fell by 18.7% from the previous quarter this year (2.4 million). Overall lending activity decreased from the previous quarter this year in 98% of US metropolitan areas with a population of more than 200,000, down from 210 to 206. The largest quarterly decreases were in Myrtle Beach, South Carolina (down 52.7%), Knoxville, Tennessee (down 44.5%) and Charleston, also in South Carolina (down 43%). Among the metro areas with a population of least one million that had the biggest decreases in total loans during the same period were St. Louis (down 35.8%), Miami, (down 30.4%) and Washington (down 30.1%). Significantly, no metro areas with the same population range aside from Hartford saw total loan originations increase from the second to the third quarter. In addition, among homes purchased with financing in Q3, the median loan amount was $315,000, down 4.5% from $330,000 the previous quarter, following 10 straight increases. Meanwhile, the typical down payment in the third quarter (9.3%) was also down from 10.2% in Q2, although this was up from 8.9% a year earlier. Warning over HELOCs The much-vaunted HELOCs (home-equity lines of credit) experienced a small 5% quarterly jump for the third quarter in a row, which kept the industry from seeing an across-the-board contraction, according to ATTOM. A total of 364,921 HELOCs were originated on residential properties in Q3, which was also up 47.8% year on year, with home-equity packages comprising one out of every five mortgage deals completed. However, Sharga warned that despite the increased activity of HELOCs over the past few quarters, the growth rate had “slowed down significantly on a quarter-to-quarter basis”, raising the question of whether the product was now at “near a cyclical peak”. He said: “Even with the recent increases, HELOC volume is still nowhere near the record level of activity we saw in the mid-2000s during the run-up to the financial crisis.” The largest increases for HELOCs in metro areas with a population of at least one million were New Orleans (home-equity loans were up by 52.8%), Houston (up 47.5%) and Dallas, in Texas (up 35.4%). FHA and VA loans upMortgages backed by the Federal Housing Administration (FHA) rose as a portion of all lending for the fourth straight quarter, ATTOM revealed. They accounted for 11.4% of all residential property loans originated in the third quarter this year, up from 10.7% in Q2 and by 9.3% year on year. Residential loans backed by the US Department of Veterans Affairs (VA) also experienced an uptick, accounting for 5.2% of all residential property loans originated during the same period, representing a 5.1% increase from the previous quarter, although this was down from 6.3% a year earlier.  Find out how the various servicers fared.
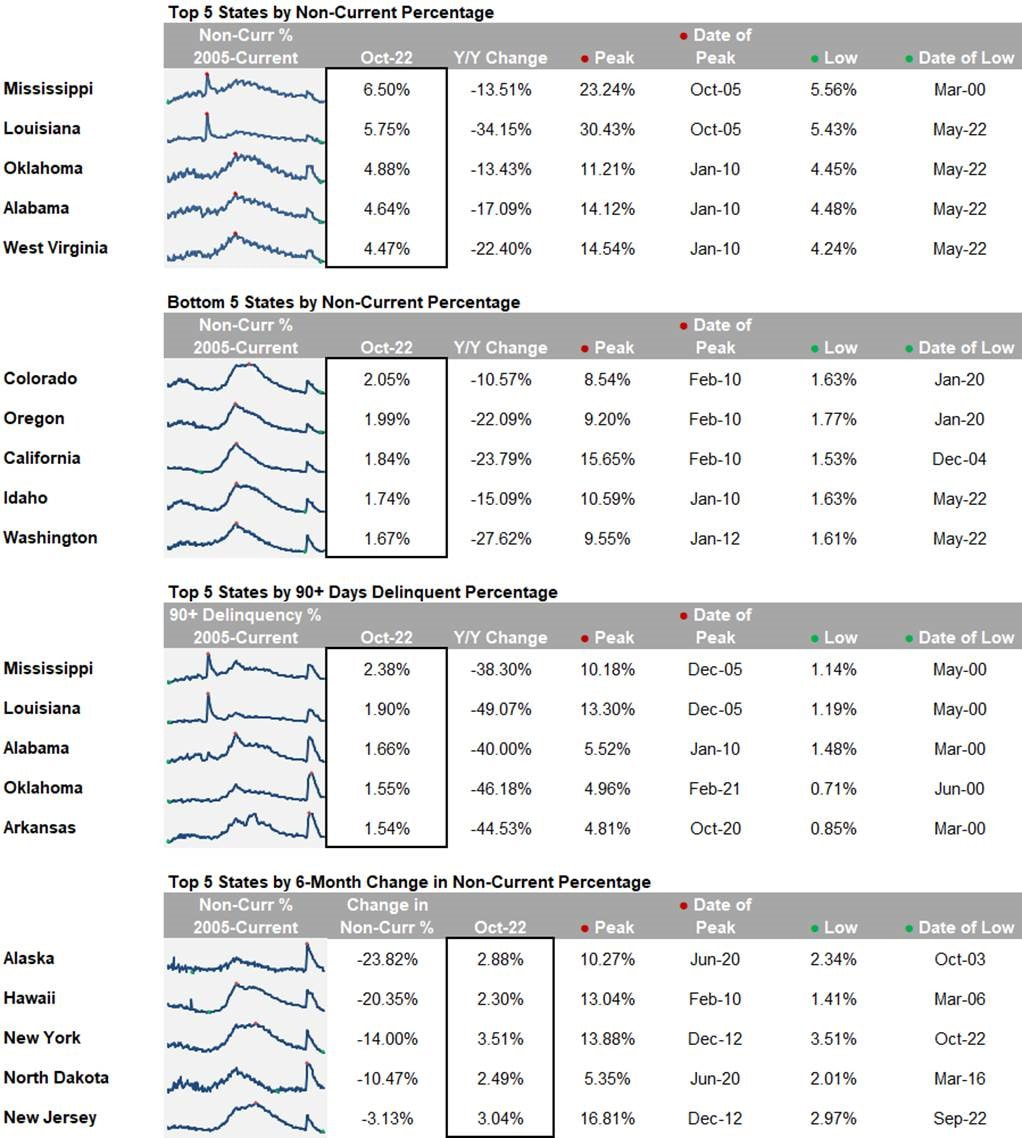
Loans in forbearance have increased by one basis point to 0.70% of lenders’ portfolio volume in what is the first monthly increase in 29 months, new numbers reveal. By the Mortgage Bankers Association’s estimate, this means roughly 350,000 homeowners are now in forbearance plans. The Mortgage Bankers Association (MBA) has released its monthly loan monitoring survey, which surveys servicers on all loans in forbearance regardless of the borrower’s stated reason. The share has increased from 0.69% in September to 0.70% as of October 31. Fannie Mae and Freddie Mac loans in forbearance also increased by one basis point to 0.31%, while Ginnie Mae loans in forbearance jumped eight basis points to 1.41%. MBA’s vice president of industry analysis Marina Walsh said that while the overall proportion of loans in forbearance rose slightly in October, it was “a mixed bag” in terms of investor type. “The forbearance rate for Ginnie Mae, Fannie Mae, and Freddie Mac loans increased, and there was a decline in portfolio and PLS loans in forbearance [from 1.14% to 1.03%],” she said. “Several factors were behind the first monthly increase in forbearances in 29 months, including the effects of Hurricane Ian in the Southeast, the diminishing number of loans bought out of Ginnie Mae pools and placed in portfolio, and the fact that new forbearance requests have closely matched forbearance exits for the past three months.” The total share of loans that were current decreased by 15 basis points to 95.7% on a month-on-month basis. Forty-four (44) states reported declines that were not delinquent or in foreclosure. Unsurprisingly, Florida – the hardest-hit by Hurricane Ian – experienced the biggest drop in the share of loans that were current. The states with the highest share of loans that were current relative to the servicing portfolio were Washington, Idaho, Colorado, Utah, and Oregon, while the states with the lowest share were Mississippi, Louisiana, New York, West Virginia, and Indiana. By stage, 36.7% of all loans in forbearance were in the initial stage of their forbearance plans, while 50.9% were already in a forbearance extension. Forbearance re-entries and re-entry extensions made up the remaining 12.4%. MBA’s loan monitoring survey also studied cumulative forbearance exits from June 1 through October 31 this year. At the time of forbearance exit, almost 30% resulted in a loan deferral or partial claim, 16% resulted in a loan modification, and 11% resulted in reinstatements, with past-due amounts paid back when existing. Roughly 7% resulted in loans paid off by selling the home or through a refinance. MBA’s loan monitoring survey represents two-thirds of the first-mortgage servicing market – or 32.9 million loans.  Deal cancellations and price cuts also reach new highs.
Pending home sales fell to record lows in October as deal cancellations and price cuts reached new highs, according to a report from Redfin. October saw pending sales drop 32.1% year-over-year, marking the largest decline since Redfin’s records began in 2013. A record number of home purchase agreements fell through as well, with 17.9% of homes going under contract last month. Additionally, nearly a quarter (23.9%) of homes for sale experienced a price cut, doubling the rate from the previous year. Pending home sales fell the most in Allentown, PA (-54.9%), according to Redfin, followed by Greensboro, NC (-50.4%), Honolulu (-47.3%), Salt Lake City (-46%) and Jacksonville (-45.9%). Likewise, the highest percentage of deal cancellations were seen in Jacksonville (30.6%), Tampa (26.7%), San Antonio (26.6%), Atlanta (25.2%) and Las Vegas (25.1%), while the largest price cuts were in Boise, ID (68.7%), Denver (56.8%), Indianapolis (54.7%), Salt Lake City (54.7%) and Tacoma, WA (52.5%). As the average 30-year fixed mortgage rate surged close to 7% in October, new listings also dropped 24% year-over-year. Redfin said this was the sharpest fall it has recorded since April 2020, when the pandemic slowed the housing market “to a near halt.” “The Fed’s actions to curb inflation are causing the housing market to slow at a pace not seen since the financial crisis,” said Redfin economics research lead Chen Zhao. “There are already early but promising signs that inflation is cooling, which caused mortgage rates to drop last week. If that progress continues, buyers who recently backed out of deals may return to the market and sellers may be less inclined to slash their prices.” Despite the sales slowdown, Redfin’s report maintained that prices still have room to fall. While the median home price fell 1.4% month-over-month in October, it was up 4.9% from last year. Redfin said prices may ease as competition slows and listings stay on the market for longer, considering homes that sold in October were listed for a median of 35 days compared to the 21 days reported a year ago. Moreover, less than half (44.6%) of home offers written by Redfin agents faced competition, down from 67.3% in October 2021.  Income required to buy a home nearly 50% higher than a year ago.
The annual income required to afford the $2,682 monthly mortgage payment on a typical US home has jumped 45.6% from a year ago, according to a new report by Redfin, with households now needing to earn $107,281 to buy a home.Redfin said the increase was due to mortgage rates climbing to record highs in 2022, combined with “persistently high” home prices. Over that same period, the average hourly wage in the US grew by only 5% as inflation cut into household budgets. “High rates are making buyers rethink their priorities, as many of them can no longer afford the home they want in the location they want,” said Chelsea Traylor, a Redfin agent in Washington, DC. “If you had a $900,000 budget a few months ago, rising rates mean it’s now around $700,000 - and sellers aren’t dropping their prices enough to make up for the change. So, buyers are searching further away from the city in more affordable areas or waiting for prices and/or rates to come down before making a move.” In 39 of the 93 metropolitan areas included in Redfin’s report, buyers would need at least 50% more income than they did a year ago to afford a home. They would also need to make at least $100,000 annually in 45 of these areas. The majority of the metros where the income required to buy a home increased are located in the Sun Belt, as these destinations have long been popular for their relative affordability and warm weather. The increases were especially significant in Florida, with buyers in North Port needing to earn $131,535 annually to afford the typical monthly mortgage payment of $3,288 in the area. This was 73.9% more than last year’s figures, representing the biggest percentage increase of any major metropolitan area. Miami’s income requirements also grew 63.7% to $128,892, as well as Tampa ($101,682, up 62.4%) and Cape Coral ($104,943, up 60.6%). The smallest uptick in required income was seen around Chicago and the Bay Area, where increases hovered at around 30%. Lake County, IL had the smallest gain in income at 33.5%. In San Francisco, homebuyers would need to earn 33.6% for the typical monthly payment of $10,071. This was followed by San Jose ($363,265, up 36.1%) and Oakland ($247,559, up 36.2%). Redfin said these areas were among the few places in the US where home prices have been falling year-over-year. “I’m encouraging buyers to think long term,” said Traylor. “Prices are unlikely to fall drastically in the long run, so buying a home now - if you can afford the monthly payment - will still help you build wealth over time, especially if you plan to live in it for several years. Even though rates are high, another advantage of buying now is the lack of competition and opportunity to negotiate with sellers.” Detroit had the lowest income requirement for a median-priced home at $48,435, up 42.3% from last year. This was followed by Dayton, OH ($51,126, up 46.1%), Cleveland ($53,817, up 45.7%), Rochester, NY ($56,508, up 56.2%) and Pittsburgh ($57,853, up 41.7%).  The latest numbers from the NAHB.
Homebuilder sentiment has dropped by another five points in November, hitting its lowest level in a decade excluding the months immediately following the pandemic. The National Association of Home Builders/Wells Fargo gauge registered a 33 this month, from 38 last month and 83 last year. The number surpassed even economists’ gloomy predictions of 36 this month. The index is designed to take the pulse of the single-family housing market by asking NAHB members to rate current market conditions for the sale of new homes and in the next six months, as well as the traffic of prospective buyers. It has witnessed a continuous drop in market sentiment through every month this year, further extending the longest stretch of declines the index has seen since 1985. All three index components registered declines this month. The sentiment for present single-family sales dropped by six points from 45 to 39, while that for future single-family sales slid four points to 31, hitting another record-low for the decade. The data for present single-family sales and the traffic of prospective buyers were also at their softest levels since April 2020, Bloomberg said, and a majority of American consumers reportedly do not plan to move in the coming year. On a regional scale, the NAHB index revealed that builder sentiment fell in all regions except the West, with the Northeast registering a 17-point drop from the previous month – the largest across all regions. The housing market, which is especially susceptible to higher borrowing costs, has been among the first sectors to feel the impact of the Federal Reserve’s tightening campaign. “Higher interest rates have significantly weakened demand for new homes as buyer traffic is becoming increasingly scarce,” said NAHB chair Jerry Konter, referring to the highest inflation rate the US has seen in decades and the government’s efforts to curb them. The same efforts could cause house prices to tumble as much as 20% in the near future, according to research from the Dallas Fed.  Single-family construction remain down as multifamily sees moderate declines.
Residential construction in the US continued its downward trend in October as the cooling effect of record-high mortgage rates keeps demand for single-family down. Data from the Census Bureau revealed privately-owned housing starts in October were at a seasonally adjusted annual rate of 1.43 million, down 4.2% from the revised September estimate of 1.49 million and 8.8% below the previous year’s rate of 1.56 million. The downward trend in housing starts was particularly evident for single-family construction, which fell 6.1% below September’s revised figure to a seasonally adjusted annual rate of 855,000. Fannie Mae chief economist Doug Duncan said such a decline is in line with industry expectations as “rising mortgage rates continue to weaken homebuying demand.” “[This] is evidenced by this week’s survey from the National Association of Home Builders (NAHB) showing yet another decline in homebuilder confidence and the lowest foot traffic of prospective buyers since 2012, when excluding the initial COVID shock,” said Duncan. With homebuilder confidence down, Duncan added that October’s 3.6% decline in single-family building permits is “hardly surprising.” “We also know from previous reports that builders have a growing inventory of completed new homes for sale, suggesting they will likely pull back on future projects until they can move their completed inventory,” he said. Housing units authorized by building permits were at a seasonally adjusted annual rate of 1.53 million in October, according to the Census Bureau, falling 2.4% below September and 10.1% below October 2021. Single-family permits slid down to a rate of 839,000 from the revised September figure of 870,000. Compared to single-family, the declines in multifamily construction were modest. The Census Bureau reported multifamily starts were at a seasonally adjusted rate of 556,000 in October. This is 0.5% below September and 17.3% above October 2021. Meanwhile, October’s multifamily permits were at a rate of 687,000, down 0.7% from September and 31.5% over 2021. Despite these modest declines, Duncan said there is a likelihood that multifamily construction will also slow down as “private incoming data shows moderating rent growth and modestly higher vacancy rates.” “Historically, changes in the direction of multifamily construction tend to lag movements in the single-family market,” he said. The Census Bureau’s latest new residential construction report, released jointly with the Department of Housing and Urban Development, also revealed figures for housing units completed in October. Housing completions was at rate of 1.43 million, down 6.4% from September’s numbers. Single-family completions fell 8.3% to a rate of 961,000, while multi-family completions were at 362,000. |
|

- iMove Chicago
- Real Estate School
-
Laws
-
CRLTO
>
- 5-12-010 Title, Purpose And Scope.
- 5-12-020 Exclusions.
- 5-12-030 Definitions.
- 5-12-040 Tenant Responsibilities.
- 5-12-050 Landlord’s Right Of Access.
- 5-12-060 Remedies For Improper Denial Of Access.
- 5-12-070 Landlord’s Responsibility To Maintain.
- 5-12-080 Security Deposits.
- 5-12-081 Interest Rate On Security Deposits.
- 5-12-082 Interest Rate Notification.
- 5-12-090 Identification Of Owner And Agents.
- 5-12-095 Tenants’ Notification of Foreclosure Action.
- 5-12-100 Notice Of Conditions Affecting Habitability.
- 5-12-110 Tenant Remedies.
- 5-12-120 Subleases.
- 5-12-130 Landlord Remedies.
- 5-12-140 Rental Agreement.
- 5-12-150 Prohibition On Retaliatory Conduct By Landlord.
- 5-12-160 Prohibition On Interruption Of Tenant Occupancy By Landlord.
- 5-12-170 Summary Of Ordinance Attached To Rental Agreement.
- 5-12-180 Attorney’s Fees.
- 5-12-190 Rights And Remedies Under Other Laws.
- 5-12-200 Severability.
- Illinois Eviction Law (Forcible Entry And Detainer)
- Illinois Security Deposit Return Act
-
CRLTO
>
- Today's Cool Thing
- Social Media

