 They are now at their highest level since the housing market crashed.
Average long-term US mortgage rates jumped by more than a quarter-point this week to their highest level since 2008 as the Federal Reserve intensified its effort to tamp down decades-high inflation and cool the economy. Mortgage buyer Freddie Mac reported Thursday that the 30-year rate climbed to 6.29%, from 6.02% last week. That’s the highest it’s been since October of 2008 when the housing market crashed, triggering the Great Recession. Rapidly rising mortgage rates threaten to sideline even more homebuyers after more than doubling in 2022. Last year, prospective homebuyers were looking at rates well below 3%. On Wednesday, the Federal Reserve bumped its benchmark borrowing rate by another three-quarters of a point in an effort to constrain the economy, its fifth increase this year and third consecutive 0.75 percentage point increase. Perhaps nowhere else is the effect of the Fed’s action more apparent than the housing sector. Existing home sales have been in decline for seven straight months as the rising cost to borrow money puts homes out of reach for more people. The National Association of Realtors said Wednesday that existing home sales fell 0.4% last month from July to a seasonally adjusted annual rate of 4.80 million. Sales fell 19.9% from August last year, and are now at the slowest annual pace since May 2020, early in the pandemic. The national median home price jumped 7.7% in August from a year earlier to $389,500. As the housing market has cooled, home prices have been rising at a more moderate pace after surging annually by around 20% earlier this year. Before the pandemic, the median home price was rising about 5% a year. In the four weeks ended Sept. 11, home listings fell 19% from a year earlier, the largest drop since May 2020, the real estate brokerage Redfin found. Many potential homebuyers are opting out of the market as the higher rates add hundreds of dollars to monthly mortgage payments. On the other end, many homeowners are reluctant to sell as they are likely locked into a much lower rate than they’d get on their next mortgage. The Fed’s move Wednesday boosted its benchmark short-term rate, which affects many consumer and business loans, to a range of 3% to 3.25%, the highest level since early 2008. Fed officials forecast that they will further raise their benchmark rate to roughly 4.4% by year’s end, a full point higher than they envisioned as recently as June. And they expect to raise the rate again next year, to about 4.6%. That would be the highest level since 2007. By raising borrowing rates, the Fed makes it costlier to take out a mortgage and an auto or business loan. Consumers and businesses then presumably borrow and spend less, cooling the economy and slowing inflation. Mortgage rates don’t necessarily mirror the Fed’s rate increases, but tend to track the yield on the 10-year Treasury note. That’s influenced by a variety of factors, including investors’ expectations for future inflation and global demand for US Treasury's. Recently, faster inflation and strong US economic growth have sent the 10-year Treasury rate up sharply, to 3.65%. The average rate on 15-year, fixed-rate mortgages, popular among those looking to refinance their homes, jumped to 5.44% from 5.21% last week. That’s the highest level since 2008. Last year at this time the rate on a 15-year mortgage was 2.15%.
0 Comments
 "The softness in home sales reflects this year's escalating mortgage rates".
Sales of existing homes in the US recorded a seventh consecutive month of decline in August, a “minor contraction” of 0.4% that showed weakening demand amid rising rates and a growing affordability crisis. Total existing-home sales dipped 0.4% month over month, and 19.9% year over year to a seasonally adjusted annual rate of 4.80 million, figures from the National Association of Realtors’ latest report showed. “The housing sector is the most sensitive to and experiences the most immediate impacts from the Federal Reserve’s interest rate policy changes,” said NAR chief economist Lawrence Yun. “The softness in home sales reflects this year’s escalating mortgage rates.” Total housing inventory dropped 1.5% from July to 1.28 million units in August. Unsold inventory sits at a 3.2-month supply at the current sales pace – unchanged from July and up from 2.6 months a year ago. “Inventory will remain tight in the coming months and even for the next couple of years,” Yun said. “Some homeowners are unwilling to trade up or trade down after locking in historically-low mortgage rates in recent years, increasing the need for more new-home construction to boost supply.” For all housing types, the median existing-home price was $389,500, about 7.7% higher than last year ($361,500). According to NAR, the August price jump marks 126 consecutive months of year-over-year increases, the longest-running streak on record. However, the median sales price retreated the second month in a row after reaching a record high of $413,800 in June – the usual seasonal trend of prices declining after peaking in the early summer. “In a sense, we’re seeing a return to normalcy with the home buying process as it relates to home inspections and appraisal contingencies, as those crazy bidding wars have essentially stopped,” said NAR president Leslie Rouda Smith. 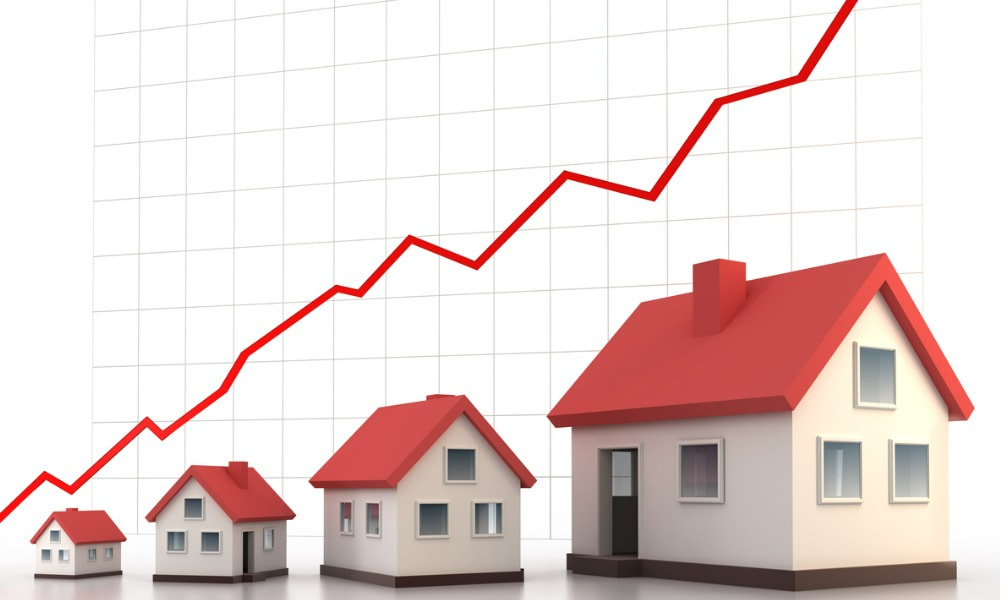 The 30-year fixed mortgage rate hit a new peak on back of aggressive Fed rate increase.
Shortly after the Federal Reserve announced another three-quarter point hike, the 30-year fixed mortgage rate hit a new record high on Wednesday, data from the Mortgage Bankers Association showed. The average contract rate on the benchmark mortgage product surged to 6.25%, exceeding the peak in October 2008. According to MBA, the rate spiked nearly 25 basis points – the most since mid-June. The rate on a five-year adjustable mortgage posted a 31-basis point increase to 5.14%. “In response to inflation continuing to run well above its target of 2%, the Federal Reserve again raised the federal funds target by 75 basis points today,” said MBA chief economist Mike Fratantoni. “At 3%, the rate is now above what most FOMC members consider to be the long-term level and should be effective in reducing demand and slowing inflation over time.” Marty Green, principal with mortgage law firm Polunsky Beitel Green, believes the Fed’s aggressive rate increases are, in no doubt, cooling the real estate market. “The rapid rise in rates is definitely slowing the pace of sales and throwing cold water on what was a frenzied residential real estate market only a few months ago,” said Green. “Where inventory was the big concern in 2021 and early 2022, the concern today is affordability, with the combination of substantial price increases and rising rates simply pricing more and more Americans out of the market.” Keller Williams chief economist Ruben Gonzalez expects mortgage rates to climb even further if the central bank continues to ratchet up the federal funds rate to slow inflation “Housing costs are heavily weighted in both Consumer Price Index (CPI) and Personal Consumption Expenditures Price Index (PCEPI) inflation calculations in the form of owner equivalent rents,” Gonzales said. “In the August CPI report, owner equivalent rents contributed 1.5% of the total 8.3% in prices over the previous 12 months. Housing made the second largest contribution to the 12-month increases in the index behind energy. As energy prices fall, housing will remain a key contributor to inflation. “Rising mortgage rates have continued to slow housing market demand, resulting in slowing sales and slower home price appreciation. We expect existing home sales to finish the year down nearly 20%, and for the slower pace of home sales to persist into the beginning of 2023.”  Plus: How affordability impacts real estate.
The short answer: Yes, there is likely to be a correction in the housing market. But let’s not call it a crash. For the difference between a correction and a crash—and to figure out if it is beneficial for you—read on. What is a ‘housing market correction’? A housing market correction is when property prices fall 10% below their peak market value. Typically, a corrective decrease in home prices comes after slowing home sales and increased inventory on the market. Is a price correction in real estate expected? The short answer: Yes. A price correction in real estate in the US is expected. It should be noted, however, that that housing correction is also expected to fall short of a housing crash. After the Federal Reserve introduced its largest increase in interest rates in years to fight rising inflation, with further increases likely, home prices are expected to drop especially in housing markets that were overinflated. Those markets, particularly in the mountain west or in the southwest, which have seen dramatic speculation, will see the price pendulum swing significantly back the other way. Boise, Idaho—which has recently been dubbed the most overvalued market in the US—in particular is due for a housing price correction. Other US cities and states that are likely to see a correction include northeast Florida, the Carolinas, and Phoenix and Tucson, Arizona. The predicted correction is not expected to bring much relief for renters, however. Potential homebuyers will still have limited options to go from leases to loans due in part to rising interest rates and the supply of starter homes for buyers being limited. Rent growth is, however, being tempered thanks to construction for multi-family housing and rising permits. A housing price correction—rather than a housing crash—is expected for a few reasons. The first is that housing vacancy rates remain at an historic low (as opposed to the historic highs prior to the financial crisis in 2008). Secondly, mortgage underwriting remains high, in terms of quality. The majority of loans are 15- or 30-year fixed-rate products. n other words, there are no signs of negative amortization or subprime activity that was so rampant prior to the foreclosure crisis. Finally, speculation and flipping across the US also remains low. Is a housing crash good or bad? Typically, a housing crash is good for homebuyers and bad for sellers. In our current financial situation, however, where a housing correction rather than a housing crash is predicted, there are some interesting factors at play. One is that current market conditions are making it more likely that millennials are coming closer to becoming first-time homebuyers, with a combined share of younger and older millennial buyers rising to 43%, according to a report by NAR. That number is up from 37% from the previous year. Another beneficial factor is white-collar workers moving from first-tier to second-tier American cities, spurring ongoing demand for housing in urban and suburban areas experiencing fast population growth. Finally, price-to-rent ratios in cities like Boise and Phoenix, while also concerning, could further motivate homebuyers. How does the affordability of a home affect the housing market? After home sellers in the US benefitted from property prices rising nearly 40% throughout the coronavirus pandemic, economists are now predicting average prices will either stall or drop due to housing correction. Across the US, home prices are expected to decrease by roughly 5% after increased mortgage rates and home prices spurred an affordability crunch. In August, economists at Goldman Sachs forecast that property prices will stall completely, with 0% growth in 2023. This activity will likely provide potential homebuyers better opportunities to enter the housing market, though higher mortgage rates continue to add to the cost of buying a house. Low incomes compared to high borrowing costs and property prices is also keeping homebuyers out. Thanks to high mortgage rates and prices, buyers are paying up to $600 more per month than they were this time last year, forcing demand to drop. But affordability may not be the only issue to impact the housing market. The coronavirus pandemic was a large reason that the demand for housing shot up. During the lockdown, in other words, many Americans sought more space, while others were working remotely and therefore relocated to more affordable centers such as Boise, Idaho, or San Francisco, California. Now that the lockdown is lifting, these trends appear to be fading. Centers that experienced disproportionate increases in building permits and home sales between 2020 and 2021 are now experiencing equally disproportionate declines. 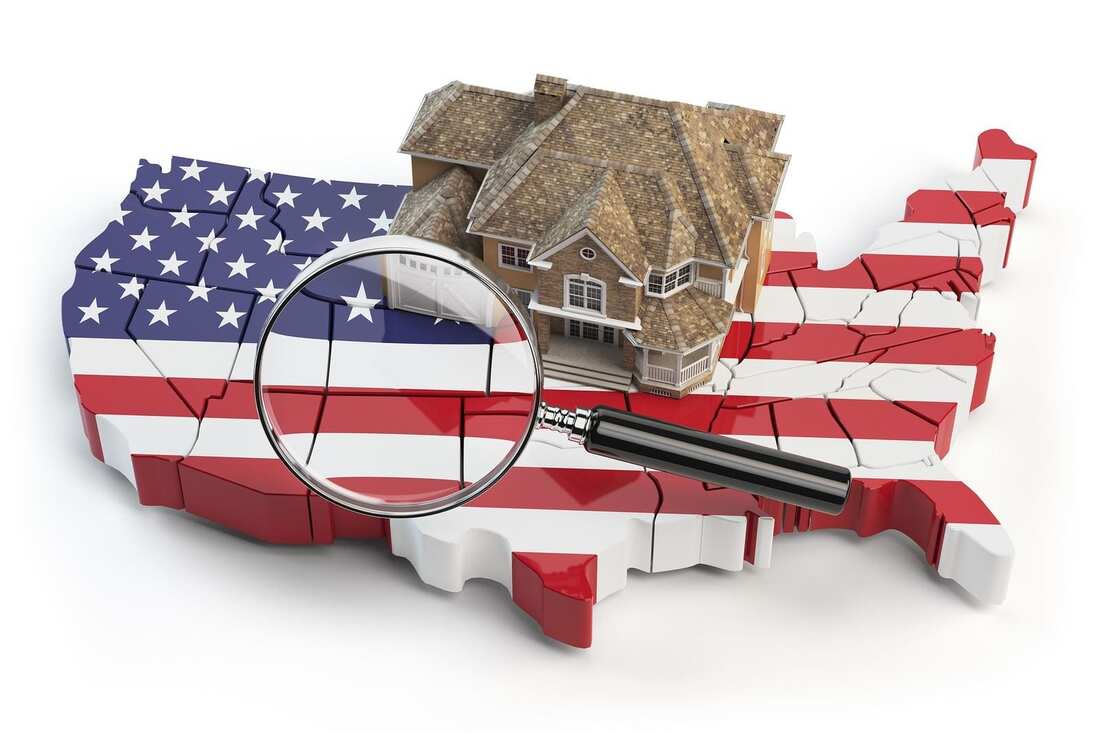 States vulnerable to foreclosures, affordability and plunging home sales named.
New Jersey, Illinois and California are among the most vulnerable housing markets in the US due to worsening affordability, slowing home sales and a rise in lender foreclosures on delinquent mortgages, according to a new report by real estate data provider, ATTOM. The Special Housing Risk Report spotlighting county-level housing markets revealed that the three states had the highest concentrations of the most-at-risk markets in the second quarter, with 33 of the 50 counties most vulnerable to potential declines. The conclusions were drawn from an analysis of the most recent home affordability, equity and foreclosure reports. ATTOM based its criteria on the percentage of homes facing possible foreclosure, average local wages required to pay for major homeownership expenses on median-priced single-family homes, as well as the portion with mortgage balances exceeding estimated property values and June unemployment rates taken at a local level. The report concluded that the Chicago and New York City areas were most exposed to potential downturns in the second quarter. The 50 most at-risk markets included nine in and around New York City, six in the Chicago metropolitan area, and 13 spread through northern, central and southern California. The biggest clusters were concentrated in the New York City and Chicago areas. The rest of the top 50 counties were scattered across the nation, including three in the Philadelphia metro area. By contrast, southern and midwestern states were less exposed to a potential downturn in the housing market. Broken down, ‘major homeownership costs’, namely mortgage payments, property taxes and insurance, ate up more than one-third of average local wages in 35 of the most vulnerable 50 counties. Moreover, at least 7% of residential mortgages were underwater in the second quarter in 23 of the most at-risk counties. Nationwide, 5.9% of mortgages fell into that category. In addition, more than one in 1,000 residential properties faced foreclosure action during the same period in 40 out of the 50 most at-risk counties, and one in 1,559 homes across the nation. The report added: “Amid that mixed scenario, home affordability is worsening, lender foreclosures on delinquent mortgages are up and the number of home sales is slowing, with local housing markets heading into that uncertain future facing significant differences in risk measures.” Rick Sharga (pictured), executive vice president of market intelligence at ATTOM, warned that the Fed’s efforts to tame inflation had failed so far but could in turn spark a recession. “The Federal Reserve has promised to be as aggressive as it needs to be in order to get inflation under control,” he said. “Given how little progress has been made reducing inflation so far, the Fed’s actions seem more and more likely to drive the economy into a recession, and some housing markets are going to be more vulnerable than others if that happens.” The report also highlighted that foreclosure actions had gone up since the expiry of the federal moratorium last July. The moratorium was put in place to prevent lenders taking back properties from homeowners who fell behind on their mortgages during the start of the COVID pandemic. More recent foreclose data from ATTOM shows that foreclosure filings — default notices, scheduled auctions or bank repossessions — went up 14% in August compared to July, and by 118% from a year ago. Illinois, Delaware and South Carolina had the highest foreclosure rates, while completed foreclosures increased 28% compared to the previous month, returning almost to pre-pandemic levels. Although foreclosure rates are expected to continue rising, ATTOM pointed out that more than 90% of borrowers in foreclosure “have positive equity in their homes”. The report nonetheless highlighted the “ongoing wide disparities in risks throughout the country” at a time when mortgage demand is at a two-decade low, sales of existing and new homes have slumped, rising mortgage interest rates have almost doubled to 6% in a year, and inflation is close to a 40-year high, all of which is conspiring to “slow down or end an 11-year surge in home prices”. Despite this, the report said there was no suggestion of “an imminent fall in housing markets anywhere in the nation”, as home prices have risen more than 10% in most of the US over the past year, which has “kept homeowner equity and home-seller profits rising”.  Housing wealth continues to drive housing demand as home price appreciation slows.
Despite a recent deceleration in home price growth, overall home equity rose to $3.6 trillion in the second quarter, CoreLogic reported Friday. Homeowners with mortgages in Q2 saw their equity increase by 27.8% year over year, representing an average of $60,000 per borrower. The total average per borrower hit a record high of $300,000, while the average loan-to-value ratio fell to 42%, the lowest since 2010. “Although US home price growth slowed on an annual basis in the second quarter of 2022, homeowners continued to gain near-record equity from the second quarter of 2021, with 15 states posting higher gains than the national average, led by Hawaii, California and Florida,” CoreLogic wrote in the report. “For many households, home equity is the only source of wealth creation,” said Selma Hepp, interim lead for CoreLogic’s office of chief economist. “As a result, recent record gains in equity and record declines in loan-to-value ratios will provide many owners with a financial buffer in case economic conditions worsen. In addition, record equity continues to provide fuel for housing demand, particularly if households are relocating to more affordable areas.” Negative equity declined by 7% to one million mortgaged homes, or 1.8% of all mortgaged properties, in the second quarter. Year over year, negative equity was down 18% to 1.3 million homes, or 2.3% of all mortgaged properties, were in negative equity. “Because home equity is affected by home price changes, borrowers with equity positions near (+/- 5%) the negative equity cutoff are most likely to move out of or into negative equity as prices change, respectively,” CoreLogic said. “Looking at the second quarter of 2022 book of mortgages, if home prices increase by 5%, 116,000 homes would regain equity; if home prices decline by 5%, 148,000 properties would fall underwater.”  Think Idaho, Utah, and Florida.
Home prices across the United States remain unaffordable for many Americans. Which cities are least affordable, however, may surprise, due in part to a recent boom in remote work. Here are the most overvalued housing markets in the US. Which are the most overvalued housing markets in the US? Property prices across the United States are expensive, and, in some cities, homebuyers are paying premiums as high as 60%. However, no city in the US is more overvalued than Boise, Idaho, according to a study conducted earlier this year by Florida Atlantic University and Florida International University. The study used data from various real estate marketplace sources to figure out the difference between the expected price of an average property according to historical trends versus the prices homebuyers are actually paying. The premium was determined by the difference between both prices. The analysis found that, due in part to a recent boom in remote work, homebuyers in Boise are paying a whopping 73% premium. Historical price data suggests the average cost of a home in Boise should be $299,202, according to researchers. However, the typical homebuyer is paying more than $516,548 on average, which translates to about $217,000 more than they should be paying. By contrast, homebuyers in Baltimore, Maryland, pay the smallest premiums—an average of just 2.6%. The other two lowest premiums, according to the study, were Honolulu, Hawaii, at 2.9%, and New York City, New York, at 3.6%. The top 10 most overvalued housing markets in the US were as follows: Boise, Idaho (73%); Austin, Texas (68%); Ogden, Utah (65%); Las Vegas, Nevada (61%); Atlanta, Georgia (58%); Phoenix, Arizona (58%); Provo, Utah (57%); Fort Meyers, Florida (56%); Spokane, Washington (56%); and Salt Lake City, Utah (56%). Are home prices rising across the US? Across the US, mortgage rates rose almost three-fourths of a percentage higher than they were at the beginning of 2021. Home prices, meanwhile, increased by 18.8% annually by the end of 2021. Those figures indicate that it is harder than ever to find affordable housing in the US. Some markets, however, are much harder to find an affordable home in than others. As mentioned, Boise, Idaho, is at the top of the list for the market with the most overvalued homes. Two other centers have also made significant leaps during the same time period. Las Vegas, Nevada, jumped from number seven to number four over a two-month period, with premiums surging another 6%. Atlanta, Georgia, went from 10th to fifth over two months, with an increase of 7% in premiums. Where are house prices in the US headed next? The housing market has already become unaffordable for most Americans, with mortgage rates on the rise and house prices nearly 20% higher than they were about this time last year. Real estate experts predict that more potential homebuyers will sit this stretch out and wait for the white-hot market to cool a little leading to an eventual slowdown. “If we’re not at the peak of the current housing cycle, we’re awfully close,” Ken H. Johnson, an economist at Florida Atlantic University, said in a news release earlier this summer. For the time being, however, low supply and high demand from potential homebuyers who still cannot afford properties is ensuring home prices remain high. Americans who purchased properties more recently are feeling the impact of that. In a report by Money and Morning Consult, roughly 54% of recent homebuyers said they compromised on their budget when purchasing their homes, while over two-thirds of buyers who closed on homes during the pandemic said they overpaid.  Credit crunch reflects reduced appetite for riskier loan programs.
Mortgage credit supply saw a slight decline of 0.5% in August as investors trimmed their ARM and non-QM loan offerings. The Mortgage Credit Availability Index (MCAI) dipped 0.5% last month to 108.3, according to the Mortgage Bankers Association. The drop in the index – benchmarked to 100 in March 2012 – indicates that lending standards are tightening, while increases signal a loosening of credit. “With overall origination volume expected to shrink in 2022, some lenders continue to streamline their operations by dropping certain loan programs to simplify their offerings,” explained Joel Kan, associate vice president of economic and industry forecasting at MBA. “Additionally, with a worsening economic outlook and signs of cooling in home-price growth, the appetite for riskier loan programs has been reduced.” Black Knight last week saw a significant drop in annual house price appreciation, down 0.77% to 14.5%. Kan, however, highlighted a small increase in the supply of new HELOC products, which slightly offset those trends. “With aggregate home equity still at elevated levels, HELOCs could benefit borrowers who might not want to give up on their current, low mortgage rate but do want to utilize their home equity to support other spending plans,” he said. Credit availability of conventional mortgages decreased by 1%, while the supply of government loans remained virtually unchanged. Of the component indices of the Conventional MCAI, the Jumbo index dropped by 0.7%, and the conforming MCAI fell by 1.2%.  Home loan application activity starts flat in September.
It was another down week for the mortgage market, with loan applications dwindling by 1.2% for the week ending September 9. Overall mortgage application volume dropped 1.2% on a seasonally adjusted basis and down 12% on an unadjusted basis, according to the Mortgage Bankers Association’s latest report. “The 30-year fixed mortgage rate hit the 6% mark for the first time since 2008 – rising to 6.01% – which is essentially double what it was a year ago,” said Joel Kan, AVP of economic and industry forecasting at MBA. “Higher mortgage rates have pushed refinance activity down more than 80% from last year and have contributed to more homebuyers staying on the sidelines.” MBA’s refinance index posted a 4% week-over-week decrease, while the purchase index inched up 0.2% on a seasonally adjusted basis. When unadjusted, however, purchase activity was down 12% weekly and 29% annually. The refinance share of total mortgage applications fell five basis points to 30.2%, while the adjustable-rate mortgage (ARM) share of activity increased to 9.1%. The FHA and USDA shares of activity both climbed one basis point to 13.4% and 0.7%, and the VA share rose five basis points to 11.3%. “Government loans, which tend to be favored by first-time buyers, bucked this trend and increased over the week, driven mainly by VA and USDA lending activity,” Kan added. “The spread between the conforming 30-year fixed mortgage rate and both ARM and jumbo loans remained wide last week, at 118 and 45 basis points, respectively. The wide spread underscores the volatility in capital markets due to uncertainty about the Fed’s next policy moves.”  New report ranks markets.
Property data analytics firm ATTOM has revealed that counties in New Jersey, Illinois, and California are the most vulnerable to a potential housing downturn. A special housing risk report analyzed 575 US counties and identified those most at risk of declines. Nine of the top 50 were in or around New York City, while six were in the Chicago metropolitan area. Another 13 – more than 25% of the 50 most vulnerable – were scattered throughout California. The same counties listed as the most at-risk from a downturn currently see some of the highest levels of unaffordable housing, unemployment, negative mortgage, and foreclosure in the country based on federal government data and the latest ATTOM reports. New Jersey came out with the top three counties most vulnerable to housing decline: Passaic, Essex, and Atlantic counties placed first, second, and third, respectively. The most vulnerable New York City counties included Kings and Richmond – covering Brooklyn and Staten Island – and seven in the suburbs: Bergen, Essex, Ocean, Passaic, Sussex, Union, and Rockland. Manhattan placed 52nd. Cook County (covering Chicago) came out seventh and was the only one in the top 25 with a population of at least one million. Counties with a population of at least half a million found among the 50 safest included: Washington’s King County (covering Seattle), Texas’s Travis County (Austin), Utah’s Salt Lake County, North Carolina’s Wake County (Raleigh) , and Cobb County in Georgia. Counties populating the bottom of the list and considered least vulnerable came mostly from the South and Midwest and featured more affordable homes and lower levels of underwater mortgages, foreclosures, and unemployment. The Federal Reserve’s recent aggressive monetary tightening and heightened inflation have stunted the housing market’s pandemic-related boom, while soaring mortgage rates have slowed sales down and pushed up the income needed to cover a regular home payment. “Given how little progress has been made reducing inflation so far, the Fed’s actions seem more and more likely to drive the economy into a recession, and some housing markets are going to be more vulnerable than others if that happens,” said ATTOM executive vice president of market intelligence Rick Sharga. |
|

- iMove Chicago
- Real Estate School
-
Laws
-
CRLTO
>
- 5-12-010 Title, Purpose And Scope.
- 5-12-020 Exclusions.
- 5-12-030 Definitions.
- 5-12-040 Tenant Responsibilities.
- 5-12-050 Landlord’s Right Of Access.
- 5-12-060 Remedies For Improper Denial Of Access.
- 5-12-070 Landlord’s Responsibility To Maintain.
- 5-12-080 Security Deposits.
- 5-12-081 Interest Rate On Security Deposits.
- 5-12-082 Interest Rate Notification.
- 5-12-090 Identification Of Owner And Agents.
- 5-12-095 Tenants’ Notification of Foreclosure Action.
- 5-12-100 Notice Of Conditions Affecting Habitability.
- 5-12-110 Tenant Remedies.
- 5-12-120 Subleases.
- 5-12-130 Landlord Remedies.
- 5-12-140 Rental Agreement.
- 5-12-150 Prohibition On Retaliatory Conduct By Landlord.
- 5-12-160 Prohibition On Interruption Of Tenant Occupancy By Landlord.
- 5-12-170 Summary Of Ordinance Attached To Rental Agreement.
- 5-12-180 Attorney’s Fees.
- 5-12-190 Rights And Remedies Under Other Laws.
- 5-12-200 Severability.
- Illinois Eviction Law (Forcible Entry And Detainer)
- Illinois Security Deposit Return Act
-
CRLTO
>
- Today's Cool Thing
- Social Media

