 After finally breaking out of a two-month slump in March, pending home sales declined again in April due to the housing shortage.
Contract signings dropped 4.4% to 106.2 in April, according to the National Association of Realtors’ Pending Home Sales Index (PHSI). Annually, the index was up 51.7% from April last year, when pandemic-related shutdowns slumped sales to an all-time low. “Contract signings are approaching pre-pandemic levels after the big surge due to the lack of sufficient supply of affordable homes,” NAR chief economist Lawrence Yun said. “The upper-end market is still moving sharply as inventory is more plentiful there.” Yun expects that the increase in the comfortability of those listing and a rise in sellers will boost housing supply this fall. Regional BreakdownPending home sales in the Northeast declined 12.9% to 85.3 in April, up 96.5% year over year. In the Midwest, sales increased 3.5% to 101.1 month over month, up 39.4% from April 2020. The South PHSI declined 6.1% to 128.9 in April, up 45.3% year over year. The index in the West declined 2.6% to 92, up 57.3% from a year ago. “The Midwest region, which has the most affordable homes, was the only region to notch a gain in the latest month,” Yun noted. “Some buyers from the expensive cities in the West and Northeast, who have the flexibility to move and work from anywhere, could be opting for a larger-sized home at a lower price in the Midwest.”
0 Comments
 While nominal house price increases in the past year might have frightened analysts and made some first-time buyers question their homeownership dreams, the presence of low mortgage rates meant that buying power had actually increased steadily throughout that period. However, the March Real House Price Index from title insurance provider First American Financial indicates a reversal of that trend. For the first time in two years, overall affordability has declined nationwide and in 45 of the 50 major markets measured by First American.
“Lower mortgage rates and higher household income compared with one year ago propelled an 11% increase in house-buying power. However, surging house-buying power drives demand, and rising demand in a supply constrained market accelerates nominal house price appreciation,” said Mark Fleming (pictured) chief economist at First American. “In March, the final component of the RHPI, nominal house prices, appreciated at its fastest annual pace since 2005, 14.8%, wiping out any affordability boost from rising house-buying power. Yet, real estate is local and since house-buying power and nominal house price gains vary by city, local affordability trends may differ greatly city by city as well.” While the driving force behind this decline in affordability is an ‘econ 101’ supply-demand issue, Fleming doesn’t believe the market has yet hit equilibrium. While some prospective buyers on the margins may pull back now because of affordability, demand is still so high relative to supply that appreciation is likely to continue. The buyers most likely to struggle now, Fleming said, are first timers. Without the equity of an existing home to leverage and mortgage rates ticking up, many lack the means to win out in one of the most competitive housing markets in history. The pace of acceleration and rapid nature of demand, Fleming said, is more pronounced at the lowest end of the market, forcing greater struggles among this buying class. Of the 45 markets that saw affordability decline, Kansas City, Mo. led the pack, driven by a 4.3% decrease in household income and a 16.5% increase in nominal house prices year over year. It was followed by Phoenix and Tampa while Seattle and Austin rounded out the top five. The only five metros that saw affordability improve were already among the most expensive in the country. San Francisco led that pack, followed by San Jose, Miami, Riverside Calif., and Boston. Fleming said that if this trend continues, driven more by rising mortgage rates, a greater affordability squeeze should push more prospective buyers out of the market. That should, in turn, prompt fewer or less intense bidding wars which could cause house price appreciation to moderate. He doesn’t expect prices to fall, but a slowdown in appreciation may give builders time to bring more supply on line and allow first time homebuyers to enter the market in less stressful circumstances. As the economy reopens and wages come back for many sectors, Fleming believes that the summer purchase market will still be a hot one. Mortgage pros need to keep operating as they have, preparing as many clients as possible for the cutthroat competition that lies ahead. “As more and more people are vaccinated and the economic recovery continues, demand for labor will likely increase, and that can put upward pressure on wages as employers compete to attract employees,” said Fleming. “At the same time, mortgage rates edged down slightly in April and even dipped below 3% in May. House-buying power is likely to remain robust in the months to come, but affordability trends will likely hinge on changes in nominal house price appreciation.”  Sales of new US homes declined in April by more than forecast as higher prices limited demand, while construction backlogs continued to build.
Purchases of new single-family homes fell 5.9% to a 863,000 annualized pace following a downwardly revised 917,000 in March, government data showed Tuesday. The median estimate in a Bloomberg survey of economists called for a 950,000 rate. A jump in building materials costs is contributing to higher prices, a headwind for an otherwise robust housing market. While elevated prices are acting as brake on demand, mortgage rates near historic lows and elevated backlogs suggest steady residential construction gains in coming months that will help contribute to economic growth. The median sales price rose 20.1% to $372,400 from a year earlier. There were 316,000 new homes for sale in April, the most in a year. At the current sales pace, it would take 4.4 months to exhaust the supply of new homes, compared with 4 months in March. The number of homes sold in April and awaiting the start of construction -- a measure of backlogs -- increased 16.5% from a month earlier to 325,000, the highest since 2006, Tuesday’s report showed. Builders have been constrained by supply-chain challenges and rising materials costs in recent months. The total number of homes sold with construction underway dropped in April to the lowest since June, underscoring the difficulty builders are having with shipments of materials. Supply shortages help explain why construction of new homes fell 9.5% in April, a separate report last week showed. Separate figures on Tuesday showed nationwide home prices soared in March by the most since 2005. The S&P CoreLogic Case-Shiller index of property values jumped 13.2% from the same month last year. Digging Deeper
Is housing market demand starting to weaken? Pending sales and purchase applications decrease5/24/2021  Nearly 50% of homes sold for more than their list price during the four weeks ending May 16, but there are signs that housing market demand may be reaching its peak, according to a recent study from Redfin.
Pending sales for the seven-day period ending May 16 were down 10% from four weeks prior, compared to an 8% increase during the same period in 2019. Mortgage purchase applications also decreased 4% week over week. “Make no mistake, the housing market is still very hot and will remain hot for the rest of the year,” said Daryl Fairweather, Redfin chief economist. “But there may be signs that some buyers would rather spend their money on restaurants, vacations, and other things they have held back on for the past year, instead of on housing now that the threat of the pandemic is dissipating in America.” New listings of homes for sale were down 12% from the same period in 2019, and active listings — the number of homes listed for sale at any point during the period — fell 49% from the same period in 2019. (2019 is being used as a reference point since 2020 data is skewed by the pandemic.) This is happening, of course, with prices remaining astronomically high. Home prices were recently reported at a record high of $352,975, and were up 24% year over year. Asking prices increased to $358,975, also a record high. Homes in May are also on the market for an average of only 17 days. Join us for this webinar as panelists from Tavant and Douglas Elliman Real Estate unpack the trends like virtual home tours and AI-driven prospecting that are sparking a revolution in real estate. Mortgage rates also spiked in the last week, jumping six basis points to 3% — a possible detriment to would-be homebuyers who were eyeballing the sub-3% rates the country saw earlier this year and during the peak months of the COVID-19 pandemic. Regional numbers also reflect the enormous difference in housing market demand from April 2020. The number of homes sold in April was up 34% from a year earlier, but only 8% from the same time in 2019. The only metro area that saw home sales decline was Rochester, New York (-3%). The largest gains in sales were in places that had the most abrupt slowdown of home sales in April 2020, including San Francisco (up 184%), San Jose (up 150%), and Miami (up 120%). Median home prices increased from a year earlier in all of the 85 largest metro areas Redfin tracks. The smallest increase was in Honolulu, Hawaii, where prices went up 0.2% from a year ago. The largest home price increases were in Austin (up 42%), Oxnard, California (up 26%) and Miami (up 26%).  Existing-home sales declined for the third consecutive month in April, according to the National Association of Realtors.
“Home sales were down again in April from the prior month, as housing supply continues to fall short of demand,” said NAR chief economist Lawrence Yun. “We’ll see more inventory come to the market later this year as further COVID-19 vaccinations are administered, and potential home sellers become more comfortable listing and showing their homes. The falling number of homeowners in mortgage forbearance will also bring about more inventory.” Total existing-home sales were down 2.7% from March to a seasonally adjusted annualized rate of 5.85 million. Despite the decline, sales were up 33.9% from a year ago (4.37 million in April 2020). “Housing demand is still strong compared to one year ago, evidenced by home sales from this January to April, which are up 20% compared to 2020,” Yun said. “The additional supply projected for the market should cool down the torrid pace of price appreciation later in the year.” The median existing-home price for all housing types rose 19.1% year over year to a record high of $341,600 – marking 110 straight months of annual gains. Total housing inventory grew 10.5% month over month to 1.16 million units but was down 20.5% from last year’s 1.46 million units. Meanwhile, unsold inventory was at a near-record low of 2.4-month supply. Properties typically sat on the market for 17 days in April, down from 18 days in March and from 27 days in April 2020. Around 88% of the homes sold in April were on the market for less than a month, according to NAR. Single-family home sales posted a 3.2% month-over-month drop, down to a seasonally adjusted annual rate of 5.13 million in April. The median existing single-family home price spiked 20.3% to $347,400 year over year. Existing condominium and co-op sales were up 1.4% at an annualized rate of 720,000 units. The median existing condo price was recorded at $300,400, up 12.6% from a year ago. “The demand for homeownership in America is as strong as it’s ever been, and NAR continues working with policymakers across the country to find solutions to the issues we face in our industry,” said NAR President Charlie Oppler. “Ultimately, though, buyers still recognize that securing a home is one of the best ways to build long-term wealth, and Realtors® continue their work to make that dream a reality for families everywhere.”  Rent growth in the US continued to exceed pre-pandemic rates in March, spurred by a re-opening economy and rising demand for high-end rentals.
Occupancy rates for single-family rentals were at a record high, according to the US Census. This increased demand is driving up inventory pressure and rent price changes nationally and across major metro areas. Stats from CoreLogic showed that nearly 70% of consumers agree that steep homes prices are causing many people to rent. However, as demand continues to push rent prices higher, 36% of survey respondents already feel rental options in their neighborhood are not very, or not at all, affordable. “The CoreLogic Single-Family Rent Index shows a preference shift to standalone properties as renters seek more space in less dense areas,” said Molly Boesel, principal economist at CoreLogic. “Prior to the pandemic, rents for detached properties and attached properties grew at similar rates. However, starting in June 2020, rent growth for detached properties accelerated and by March, grew at five times the rent growth rate of attached properties.” National single-family rent growth across the four tiers, and the year-over-year changes, were as follows:
Phoenix posted the highest year-over-year gain in single-family rents in March at 11.4%. Tucson, Ariz. came in second with a 10.4% increase and Atlanta, which had the second-lowest unemployment rate in March among the 20 metro areas, followed at 8.1%. At the other end of the spectrum, Boston experienced an annual decline of 7.7% in rent prices and has seen the largest decrease in rent prices for eight consecutive months. 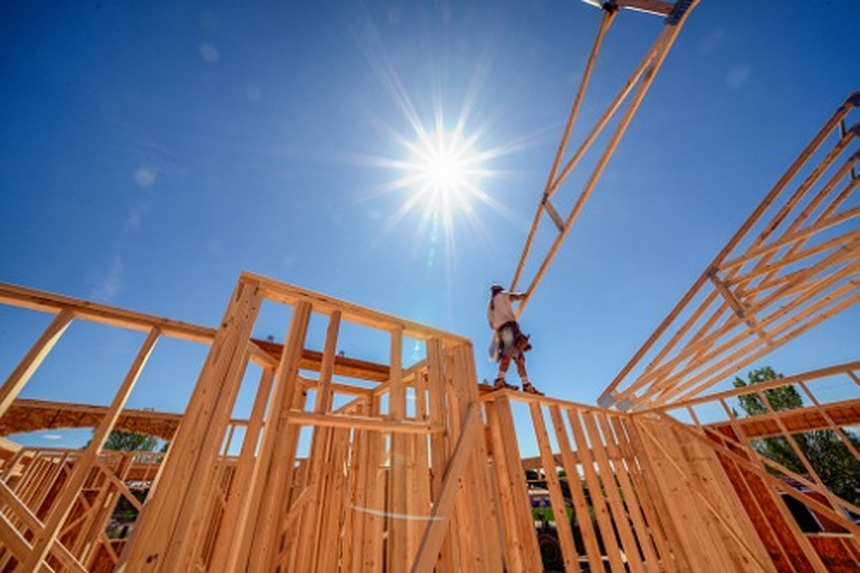 US housing starts plunged 9.5% in April due to escalating lumber prices and supply bottlenecks.
Driven by the decline in single-family starts, overall housing production fell 9.5% month over month to a seasonally adjusted annual pace of 1.57 million units, according to a report from the US Department of Housing and Urban Development and the US Census Bureau. Single-family starts were down 13.4% month over month to a 1.09 million annualized rate. Meanwhile, the multifamily sector (apartment buildings and condos) inched up 0.8% to a 482,000 pace. “Single-family starts in April dropped more than 13% compared to last month, but permits to build single-family homes saw a smaller decline,” said MBA chief economist Mike Fratantoni. “This is consistent with reports that builders are delaying starting new construction because of the marked increase in costs for lumber and other inputs. Moreover, builders are also reporting difficulty obtaining other inputs like appliances.” Frantantoni added that these challenges are pricing out potential homebuyers from an otherwise hot housing market. But even with these constraints, there are approximately 640,000 new homes under construction right now – a helpful addition to low supply levels. Overall permits in April were at a seasonally adjusted annual rate of 1.76 million, up 0.3% month over month. Single-family permits posted a 3.8% month-over-month dip to a 1.15million-unit rate, while multifamily permits jumped 8.9% to a 611,000 pace. The number of single-family homes permitted but not started construction is on an upward trend, rising to 131,000 units – 47% higher than a year ago. Housing completions, on the other hand, were down 4.4% from the revised March estimate of 1.52 million units to the April rate of 1.45 million units. “The fundamentals driving new home sales are strong – low rates, limited supply of existing homes for sale and demand driven by millennials. The pandemic and the desire for more space has accelerated this lifestyle decision. You can’t buy what’s not for sale, but you can build it,” said First American Deputy chief economist Odeta Kushi. “Builders want to build. May’s Home Builder Sentiment Index remained unchanged from April’s strong reading of 83. Of the index’s three components, sales expectations increased by one point. However, the cost and availability of building materials remain a challenge.”  The Biden administration said Tuesday it will repeal changes made by the Trump administration to a law aimed at stopping banks from discriminating against racial minorities and the poor.
The Office of the Comptroller of the Currency, one of the nation’s bank regulators, said it plans to reconsider the regulations written in 2020 governing a law known as the Community Reinvestment Act. The civil rights era law requires banks to document the extent of their lending to the communities that surround their branches in order to ensure they are not just lending to the wealthy or to white customers. The OCC said it plans to start from scratch, and told banks to effectively ignore the 2020 changes while the agency rewrites the regulations. Trump’s Comptroller of the Currency, Joseph Otting, had made revising the Community Reinvestment Act a cornerstone of his tenure. The law is widely respected by the industry and activists alike, but both sides have agreed for years that it was out of date. Many banks now operate entirely online, ATMs are ubiquitous, and it is increasingly more difficult to define what a “community” is in order to comply with the law. While Otting said he wanted to modernize the law to reflect changes in the banking industry, his proposal was considered too broad for many activists and for Democrats overseeing banks on the Senate Banking Committee and House Financial Services Committee. Sen. Sherrod Brown, D-Ohio and chairman of the Senate Banking Committee, said in a statement that the OCC’s decision was “a step in the right direction.” He said the regulations were “jammed through last year against the advisement of civil rights leaders, community development activists, and local voices.” Under the CRA, banks must pass exams to show they are making enough loans in their communities. Banks are required to get a passing grade on the exam in order to open more branches or merge with other banks. But among the 2020 changes to the law, banks would have been given credit toward passing the exam from issuing credit cards and, under certain circumstances, for loans they make to build or improve facilities such as sports stadiums and hospitals. Activists argued these changes would have made it easier for many banks to pass their CRA exams and would disincentivize them from opening branches or approving mortgages in low-income neighborhoods. Civil rights activists have long argued that the law was a powerful tool to get banks to address the systematic financial inequalities in this country. For example, CRA examinations are often a starting point for prosecutors at the Department of Justice when investigating potential cases of redlining. “CRA was, and still is, a civil rights bill,” said Rep. Gregory Meeks, D-New York, last year at a congressional committee hearing reviewing Otting’s changes. “Your proposal would undermine that.” The changes proposed by Otting were so drastic that the other two bank regulators that have authority under the law, the Federal Reserve and the Federal Deposit Insurance Corporation, refused to sign on to the OCC’s changes. This left banks wondering which regulator to follow when it came to compliance. The Biden administration’s move is “encouraging news,” said Richard Hunt, CEO of the Consumer Bankers Association, an industry trade group for the nation’s bigger retail banks. “We hope regulators and politicians put politics aside and find common ground to best serve communities across the nation.”  The National Association of Home Builders (NAHB) estimated that regulatory costs have added $93,870 to a new single-family home's current average sales price, up 23.8% to $397,300.
NAHB attributed $41,330 of the extra $93,870 costs to regulation during development, while $52,540 was due to regulation during construction. It also reported a 10.9% jump in its regulatory costs estimates between 2016 and 2021, up from $84,671 to $93,879 during the five-year period. "This study illustrates how overregulation is exacerbating the nation's housing affordability crisis and that policymakers need to take bold steps to reduce or eliminate unnecessary regulations that will help builders increase the production of quality, affordable housing to meet growing market demand," said NAHB Chairman Chuck Fowke. The association noted that the cost of regulation does not affect how rising lumber and other material prices have raised housing costs over the past 12 months. In a separate study, NAHB found that lumber prices – which have tripled since April 2020 – have added $35,872 to the price of a typical new home. This is on top of the $93,870 cost due solely to regulation.  Despite improving economic conditions, consumer’s optimism toward the US housing market plunged to a record low as housing supply shortage and soaring prices continued to take a toll on homebuyers.
Fannie Mae’s Home Purchase Sentiment Index (HPSI) fell by 2.7 points month over month to a reading of 79 in April. Consumers’ sentiment on home buying conditions entered negative territory for the first time in the survey’s history, according to the mortgage giant. “Consumer sentiment toward buying homes reached the lowest level in our survey’s ten-year history. Unsurprisingly, respondents overwhelmingly cited the lack of supply and high home prices as primary reasons for their pessimism,” Fannie Mae Chief Economist Doug Duncan said. “The decrease in home buying sentiment likely indicates that some consumers, potentially flush with savings – perhaps boosted in part by stimulus payments – may be attempting, but failing, to buy a home due to heightened competition for relatively few listed homes.” Duncan noted that consumers in the household income range of $50,000 to $100,000 – a range inclusive of the Census Bureau’s reported median household income level – were more pessimistic because the affordable housing segment has been particularly competitive. The decline in the home buying component was partly offset by consumers’ ongoing optimism toward home-selling conditions, which has continued its year-over-year rise and has nearly returned to its pre-pandemic peak. “Conversely, consumer positivity regarding home-selling conditions nearly matched its all-time high, demonstrating a large divergence in perceived conditions between sellers and buyers, as measured by the gap between the two components. As has become standard discourse in the housing industry recently, increasing the supply of homes for sale would certainly help bring balance to this strong seller’s market, but unfortunately, the most recent data doesn’t suggest that inventory is likely to improve in the near future,” Duncan said. HPSI component highlights:
|
|

- iMove Chicago
- Real Estate School
-
Laws
-
CRLTO
>
- 5-12-010 Title, Purpose And Scope.
- 5-12-020 Exclusions.
- 5-12-030 Definitions.
- 5-12-040 Tenant Responsibilities.
- 5-12-050 Landlord’s Right Of Access.
- 5-12-060 Remedies For Improper Denial Of Access.
- 5-12-070 Landlord’s Responsibility To Maintain.
- 5-12-080 Security Deposits.
- 5-12-081 Interest Rate On Security Deposits.
- 5-12-082 Interest Rate Notification.
- 5-12-090 Identification Of Owner And Agents.
- 5-12-095 Tenants’ Notification of Foreclosure Action.
- 5-12-100 Notice Of Conditions Affecting Habitability.
- 5-12-110 Tenant Remedies.
- 5-12-120 Subleases.
- 5-12-130 Landlord Remedies.
- 5-12-140 Rental Agreement.
- 5-12-150 Prohibition On Retaliatory Conduct By Landlord.
- 5-12-160 Prohibition On Interruption Of Tenant Occupancy By Landlord.
- 5-12-170 Summary Of Ordinance Attached To Rental Agreement.
- 5-12-180 Attorney’s Fees.
- 5-12-190 Rights And Remedies Under Other Laws.
- 5-12-200 Severability.
- Illinois Eviction Law (Forcible Entry And Detainer)
- Illinois Security Deposit Return Act
-
CRLTO
>
- Today's Cool Thing
- Social Media

