 Homebuyers, facing tightening credit standards and skyrocketing prices, are putting up the biggest down payments in at least two decades.
The median down payment for single-family homes and condos in the US was $20,775 in the third quarter, the most in records going back to 2000, according to a report from Attom Data Solutions. That’s up 69% from $12,325 a year earlier, before record low mortgage rates kicked the housing boom into a higher gear. Borrowers put up 6.6% of the median sale price of homes financed in the quarter, up from 4.7% a year earlier and the highest level since 2018. The median loan amount in the quarter of $275,500 was the highest since 2000, up 24% from the third quarter of last year. ”Down payments are rising at a time when lenders are tightening their guidelines,” said Todd Teta, chief product officer at ATTOM Data Solutions. “Lenders have grown more cautious in order to protect themselves from more delinquencies.” Mortgage companies are raking in cash in the midst of the pandemic, earning hefty margins while consumers flood in to buy homes or refinance existing loans to take advantage of record-low mortgage rates. The average for a 30-year, fixed loan tumbled to 2.72% this week, the lowest in data going back almost 50 years, Freddie Mac said Thursday. It’s no wonder that lenders have gotten more picky than they have been in decades. Lenders including JPMorgan Chase & Co. have tightened terms for borrowers amid widespread worry about future economic growth. JPMorgan, for instance, told loan officers earlier this month that it would limit jumbo loans to 70% of the sale price for most co-ops and condominiums in Manhattan. The typical borrower last quarter had a 786 credit score, the highest median score in quarterly figures dating to 1999, according to data maintained by the Federal Reserve Bank of New York. The $1.05 trillion of home mortgages originated last quarter was the highest since 2003, New York Fed data show, when homeowners across the country were taking advantage of a previous historic refinancing boom.
0 Comments
 Forbearance rates have declined for the 11th week in a row, according to the Mortgage Bankers Association’s (MBA) latest Forbearance and Call Volume Survey. The total number of loans now in forbearance decreased to 5.47%, down from 5.67%. MBA estimates 2.7 million homeowners are still in forbearance plans.
While a declining forbearance rate is good news for the US economy, that doesn’t mean these remaining borrowers are all in the clear. Marina Walsh, vice president of industry analysis research and economics at the MBA, explained why that last 5% may prove slower to emerge from forbearance. She highlighted, too, why IMBs seem to be carrying a higher forbearance rate than the big banks. “If you take all the forbearance exits from June 01 to November 08, about one third were leaving forbearance without any arrears,” Walsh said. “There was no need for a loss mitigation strategy, they were leaving for good reasons. Reinstatements, too, are as high as 17% which means that even if they were one or two months behind, they were able to come up with that full payment. “The one option that’s the most tenuous is this 13% of exits who are not current, who are not making payments, and have no loss mitigation option in place yet…In general, those leaving forbearance up to this point have been for pretty positive outcomes but what’s left here could be those borrowers that are truly distressed.” Walsh pointed to a declining monthly percentage of forbearance exits from that category of borrowers who kept up their payments and didn’t accrue any arrears. In June, according to the MBA, they comprised 49.99% of exits. In October, they were down to 19.64% of exits. Conversely, that most distressed category has grown from 7.62% of exits to 22.20%. That shift could point to a story where most of the best-off borrowers have already left forbearance and the borrowers who are left are stuck in a much worse financial position. She said a breakdown of delinquencies, as well as wider economic data, points to a tougher picture for FHA borrowers. Many of these borrowers work in lower-income service jobs that have been among the worst-hit sectors during the pandemic. Walsh believes the disproportionate struggles of FHA borrowers explains why IMBs are carrying a bigger percentage of loans in forbearance than big banks, 5.94% to 5.43%. IMBs, Walsh said, have a larger Ginnie Mae portfolio which includes FHA, RHS, and VA loans, as opposed to conventional loans. She says a higher forbearance rate by IMB servicers doesn’t mean they’re doing a “worse job,” rather it reflects a different portfolio makeup. Despite a somewhat pessimistic outlook on the state of the remaining borrowers in forbearance, Walsh says there isn’t reason for the wider housing industry to panic. She stressed that 2020 is not 2008 and the underlying strength of the housing market means even distressed borrowers could be saved by the growing equity in their homes and huge demand from homebuyers. “Distressed borrowers are going to be helped out by potential equity accumulation,” Walsh said. “There could be equity in their homes, combined with house price appreciation because we’re in this pretty significant housing inventory crisis. There’s plenty of mortgage demand because interest rates are still really low. If you look at our MBA forecast on where things are heading, we expect purchase originations to still go up over the next three years. “Is every situation perfect? No. But distressed borrowers are potentially in a better situation in 2020, than they were in 2010.”  Rapidly rising housing prices in the US has led to talk of another housing bubble like the one that helped trigger the financial crisis a little more than a decade ago. Consider that the Case-Shiller National Home Price index has gained in excess of 6% per year on average since January 2012, while net rental income has barely kept up with inflation, increasing just less than 2% per year. The result is that home prices seem as overvalued as they were in the spring of 2005, nine months before the peak.
One way to measure home valuations is with a cyclically adjusted price to earnings (CAPE) ratio developed by Yale University professor and Nobel Laureate Robert Shiller for stocks. The concept can be applied to a broad swath of assets by dividing the current price of an asset by the average annual inflation-adjusted earnings over the prior 10 years. Stock valuations soared in the late 1990s, only to crash from 2000 – 2002, tread water for six years, then tumble again in 2008. Home valuations ignored the 2000 equity crash, but shared the 2008 crash. Since then the two have increased roughly in line, but with home prices starting from a higher level. As a result, equity valuations are still well below peak values, but home prices are approaching the historic highs. Much of the focus on the housing market lately has centered on the short-term environment, with the low inventory of homes cited for rising prices and a jump in rental vacancy rates driving rents lower. But if the concern is the possibility of major economic disruption—rather than just whether houses are good investments at current prices— the focus should be on long-term macroeconomics. Sure, real estate prices always drift up or down, and differ by location and type of home. A bubble in housing requires widespread overvaluation over years, which is what we have witnessed. Home valuations are worrisome, but for different reasons than 2006. One minor point of comfort is the run-up from 1996 – 2006 displayed a classic bubble pattern of accelerating price increases near the peak. The increase in valuations since 2012 has been linear, with no sign of steepening. A bigger difference is illustrated in the chart below, showing the CAPE ratio for housing versus 10-year US Treasury note yields (these correlate with mortgage rates, but are a better predictor of home prices statistically). In both 1996 – 2002 (grey dots) and 2014 – 2020 (white dots) home values linearly decreased with interest rates, at about an 8% decline in valuations for every 100 basis-point increase in yields. This is in line with longer history. But during the 2003 – 2013 bubble and crash (blue dots), there was a much steeper relation in the opposite direction—higher home values associated with higher yields. The reason for the reversal during the housing bubble was capital rushing into mortgages via structured investment products, insulating home buyers from paying higher rates. More than half of new mortgages were adjustable with low teaser rates divorced from economic reality. Today, less than 10% of new mortgages have adjustable rates, according to data from Freddie Mac. In 2005, investors were pushing mortgage originators to prod home buyers into paying higher prices by providing them with easy access to funds. This was not a price increase driven by demand for housing. The bubble popped for financial reasons, not housing reasons, and—unlike previous waves of mortgage defaults—it brought much of the financial system down with it. Today’s high valuations can be explained by low interest rates, as has been the usual pattern in the past. That might lead one to expect a typical correction, where housing prices deflate over a few years with differences among regions. Many homeowners are hurt in places where prices were especially high, and also in places with especially bad economic problems, but nationally diversified mortgage securities follow historic trends and financial institutions deal with losses seamlessly. Homeowners who can wait out the decline will see valuations increase above their purchase prices in five years or so. The bad news is all previous history came at higher mortgage rates. The average 30-year fixed mortgage rate fell below 3% for the first time in August 2020, and rates are close to the lowest possible levels given the credit risk and costs of writing mortgages. It’s one thing to be a peak valuation, it’s another to be at peak valuation with no discernable upside. It’s implausible that housing prices can go up from here without large increases in rents, which require increases in demand for housing. That’s an unlikely outcome in a recession. If the recession continues, where will new demand come from? If it ends, interest rates go up, pushing housing prices down. The good news is this is not a disaster market. There’s no evidence home price declines could threaten the financial system, nor create mass economic distress as we saw after 2007. No doubt there remain plenty of bargains in regions with robust economies where prices have not overheated. The bad news is there’s a lot more downside than upside for average homebuyers, and some of them are very likely to suffer in 2021.  The rebound in American housing from the brief collapse of March and April has stunned almost everyone. 2020 certainly started strong for housing, but the pandemic very quickly threw the market off the rails. Whether by the unique circumstances of this year, as buyers spent more and more time at home, or the attraction of a low-rate environment, demand has recovered significantly.
Prajakta Bhide said this is “very, very unusual in a recession and needs to be further examined.” The US Economy strategist at MacroResearchBoard (MRB) Partners said that the centrality of housing to the wider US economy usually means that when housing does well, the whole US economy is doing well. “When you see this kind of pick up on housing, the natural question is, ‘is there something in the data that’s telling us that the economy’s fundamentally more solid than all the news and other reports are suggesting?,’” Bhide said. “That’s a valid question. Economists often say the housing cycle is the US cycle, so a lot of our clients asked us, ‘you see this housing recovery, and you see housing surprising on the upside. Are we missing something about the broader US economy? Are we in a better place than then?’ The answer to that, in our view, is ‘no’.” Bhide says the uptick in housing is clearly a positive for the US economy, with positive knock-on effects for other industries. However, the sustainable housing market growth we saw earlier this year, the result of a number of fundamental drivers including increasing home ownership among younger people, has not returned. Gains in home sales have been led largely by the mid and upper price tiers while the more affordable entry-level segment of the housing market has not been doing well. The average size of homes in homebuilders’ reports is rising, Bhide says, whereas in the first two months of the year the average square footage was shrinking. What this points to, Bhide says, is a market driven by affluent, existing homeowners who have kept their jobs through the pandemic and are able to take advantage of the low-rate environment to upgrade their home or move to the suburbs. Bhide says that this demand won’t disappear in the next three months, however, to have a sustained three or four-year cycle in housing, the market needs more participation from the entry-level, under-35 demographic. That demographic, Bhide says, largely sat on the sidelines post-2010, carrying scars from the Great Financial Crisis. Just as demand was beginning to pick up in this group, the pandemic came and quashed it. Bhide says that demand hasn’t recovered yet. MRB Partners isn’t pointing solely to doom and gloom, though. Bhide says the demand from higher-income demographics is certainly positive and should last for the next several months at least. In addition, forbearance policies in the CARES Act have prevented the kind of industry-wrecking foreclosures we saw in 2008 and 2009. This shifting landscape is not without its opportunities, too. Bhide expects a bounce back in major US cities over a three to four-year time horizon. She said the value of “tier-two cities” like Denver, Atlanta, or Tucson, has been significantly raised by the pandemic as buyers see an opportunity to get more for their money there. Jobs, too, are moving from big cities to suburbs and smaller urban centers. Nevertheless, with 10 million still unemployed and a logistical nightmare ahead for a vaccine rollout, if and when it comes, Bhide says there could be a rough months ahead for housing, as higher-income demand drops off and entry-level demand stays stagnant. “If you need to have broader participation in the housing market, you need to see improvement in the labor market,” Bhide says. “To see improvement in the labor market we need to see comprehensive coverage of a vaccine or a therapeutic treatment for COVID-19. That’s looking like it’s going to be a realistic story for mid-2021 or beyond that. If you last through the next three or four months on this pandemic induced homebuying wave, then you could eventually transition to that first time homebuyer driven housing upcycle, but we could have a few months where housing does start to show some shaky numbers.”  The share of mortgages in some stage of the foreclosure process was at 0.3% in August 2020 – down from 0.4% in August 2019 and the lowest it has been since “at least January 1999,” according to analytics firm CoreLogic.
However, the firm also revealed a significant increase in serious delinquency rates – or mortgages that are 90 days or more past due. The share of mortgages in serious delinquency was at 4.3% in August 2020, up 1.3% from the same period last year and the highest it has been since February 2014. August also marked an alarming increase in 150-day past-due loans, reaching a historic high of 1.2%. “Forbearance programs continue to reduce the flow of homes into foreclosure and distressed sales and has been the key to helping many families who have been particularly hard hit by the pandemic,” said Frank Martell, president and chief executive officer of CoreLogic. "Even though foreclosure rates are at a historic low, the spike in 150-day past-due loans points to bumpy waters ahead.” “Five months into the pandemic, the 150-day delinquency rate for August spiked to 1.2%,” said Frank Nothaft, chief economist at CoreLogic. “This was the highest rate in more than 21 years and double the January 2010 peak during the home-price bust. The spike in delinquency was all the more stunning given the generational low of 0.08% in March and April.” On a national level, 6.6% of mortgages were in some stage of delinquency (30 days or more past due) in August – a 2.9% increase compared to the same period last year. Every state logged an annual increase in overall delinquency rates, with popular tourism destinations showing the highest increases, with Nevada (up 5.3%), Hawaii (up 4.9%), New Jersey (up 4.6%), Florida (up 4.5%), and New York (up 4.4%) topping the list for gains.  Red flags for fraudulent activity among rental housing applicants are skyrocketing amid the coronavirus pandemic, according to a new analysis from TransUnion.
“Since the start of the pandemic, the percentage of fraud triggers detected through TransUnion’s multi-layered rental housing specific fraud solution, ResidentID, increased nearly 30% from the period of March 2020 to August 2020,” the credit rating agency said in a statement emailed to MPA. Fraud triggers – identified as applicant statuses with failed authentication and/or identified as high risk, reached a high of 15.2% in August, compared to just 10.3% over the same period in 2019, according to the analysis. “Over the course of the pandemic, this rise in fraud triggers has not only left an impact on the rental industry, it has also placed multifamily executives on high alert for fraudsters,” TransUnion said. “Fraud continues to be an increasingly concerning issue in the multifamily industry for the last several years, and the COVID-19 pandemic-driven shift to virtual leasing has pushed this concern to the forefront for property managers,” said Maitri Johnson, vice president of TransUnion’s tenant and employment business. “It is imperative that management companies take the necessary precautions and protect their business against the economic impacts brought on by the current environment, as well as the increased propensity for fraud that may not be easily evident today.” TransUnion recently surveyed 82 multifamily executives to find out how they were managing fraud concerns in the current environment. The survey found since the pandemic began, 48% of respondents said that fraud incidents had increased. Another 26% have experienced up to 100 instances of fraud in their portfolios in the past year. “While many of these organizations were able to flag fraudsters prior to move-in, 41% of respondents stated they didn’t identify the fraud until after the applicant moved in – resulting in a negative impact to the organization’s bottom line,” TransUnion said in an email to MPA. The study also found that two out of three multifamily execs were worried about future fraud growth within their communities. “As fraud evolves and fraudsters become more sophisticated in their techniques, fraud prevention strategies and solutions have become top-of-mind for industry insiders,” Johnson said. “As a result of the COVID-19 pandemic, 22% of respondents noted an identity-verification or fraud solution has been implemented to help mitigate this growing issue.”  The coronavirus recession continues to take a toll on the commercial and multifamily market, according to the Mortgage Bankers Association.
In a new report, MBA forecasted that commercial and multifamily lending will plummet 34% in 2020, down from the last year's record volume of $601 billion to just $395 billion this year. "There remains a great deal of uncertainty about the pandemic and its impacts on the economy and commercial real estate, with significant differences across property types and capital sources," said Jamie Woodwell, vice president for commercial real estate research at MBA. "The downturn is putting downward pressure on some property incomes, particularly property types most impacted by the pandemic or with shorter lease terms. With low-interest rates and investment yields, property values are likely to hold up better, which should help put a floor under sales and originations volumes this year and next." MBA's forecast revealed that total multifamily borrowing alone will likely see a year-over-year decline of 21%, falling from $364 billion to $288 billion. However, MBA expects the downturn to improve slightly in 2021, with lending activity climbing to $407 billion in commercial/multifamily mortgage bankers originations and $305 billion in total multifamily borrowing. "Through the first three quarters of 2020, multifamily sales volume was 41% lower than a year earlier, with multifamily originations down just 17%. The strong level of refinance activity of multifamily mortgages, particularly into Fannie Mae, Freddie Mac and FHA loans, is lifting overall originations activity from where it might otherwise be, and is driving differences between property types and capital sources. These contrasts are likely to remain pronounced," Woodwell said.  The total number of loans in forbearance fell seven basis points from 5.9% of servicers’ portfolio volume the prior week to 5.83% as of Oct. 25, according to the latest estimate from the Mortgage Bankers Association. The MBA estimated that 2.9 million homeowners are now in forbearance plans.
The share of Fannie Mae and Freddie Mac loans in forbearance dropped for the 21st consecutive week to 3.66% – a six-basis-point reduction. Ginnie Mae loans in forbearance dropped four basis points to 8.13%, and the forbearance share for portfolio loans and private-label securities fell eight basis points to 8.82%. The percentage of loans in forbearance for independent mortgage bank servicers fell eight basis points to 6.27%, while the percentage of loans in forbearance for depository servicers held steady at 5.86%. “With more borrowers exiting forbearance in the prior week, the share of loans in forbearance declined across all loan types. Almost half of forbearance exits to date have been from borrowers who remained current while in forbearance, or who were reinstated by paying back past-due amounts,” said Mike Fratantoni, MBA senior vice president and chief economist. “The share of loans in forbearance has returned to levels last seen in early April, but it still remains remarkably high. Further improvement will require ongoing recovery in the job market, as well as additional fiscal stimulus.”  It’s probably a good idea to talk about real estate before the country burns itself down, so let’s get to it.
Instead of factoring into the election, real estate instead provided part of its unimaginable backdrop. Despite the COVID-19-triggered recession and accusations from each candidate that his opponent would decimate the U.S. economy, the real estate and mortgage markets, driven by low interest rates and pent-up spring demand, experienced historic levels of activity. While cracks showed in American democracy, real estate built itself an impenetrable shell. It may be the perfect metaphor for the curated information bubbles most Americans live in. According to NerdWallet’s Holden Lewis, real estate is typically unimpacted by Republicans’ and Democrats’ quadrennial war. “People don't pay attention to the polls or the election results when buying and selling homes,” Lewis says. “Those decisions are driven by where people are in their life cycles.” But who winds up in the White House could have an effect on mortgage rates. How long will borrowers keep flooding lenders with applications for purchases and refinances if rates start climbing? In a recent article, Lewis found that trying to predict how an election will affect mortgage rates, which he tells Mortgage Professional America “tend to enter sit-and-wait mode in the October of a presidential election year,” is easier said than done. In 2000, the election that, because of its historic messiness, most resembles today’s, the 30-year fixed-rate mortgage remained steady in November, ranging from 7.73 percent to 7.79 percent. But it fell twice in December, once before and once after the Supreme Court decided the election in George Bush’s favor. The 30-year fixed rate was 7.13 percent at the end of the year. But in 2004, the year Bush was re-elected, rates increased, from 5.64 percent the week before the election to an average of 5.81 percent the week ending December 2. The 2008 election also offers some parallels, as it took place during the Great Financial Crisis. A week before Barack Obama was elected, the 30-year fixed rate was 6.46 percent. The week ending December 4, it had fallen to 5.53 percent. When Obama was re-elected in 2012, the 30-year fixed inched down from 3.39 percent prior to the election to 3.32 percent in the last week of November. After Trump was elected in 2016, mortgage rates swelled from 3.47 percent to 4.08 percent by December 1. “If there's any advice to give,” Lewis writes, “it's this: Don't try to time the mortgage market based on the expected election results. You might be surprised not only by the winner, but by the market's reaction as well.” While Trump’s and Biden’s approaches to housing and real estate differ on several points, from their views on Fannie Mae and Freddie Mac to their plans for increasing housing supply, Lewis feels the most glaring difference is in their stances toward the Affirmatively Furthering Fair Housing Rule, a regulation that requires local governments to determine if their jurisdictions are home to housing discrimination. “The Trump administration suspended the Obama-era implementation of the rule,” Lewis says. “Biden has said he would renew it.”  Americans who live in US congressional districts represented by a Democrat are more likely to have substantial home equity built up, according to a political housing analysis from ATTOM Data Solutions. The report showed that the average home in Democratic areas is worth 75% more than those in counties that lean Republican. Among the 3 million single-family homes sold last year in the US, the average home price in counties with Democratic members of the US House of Representatives was $428,958 – almost double the average price in Republican-leaning counties ($245,085). However, property taxes in Republican-controlled districts are nearly half of what homeowners pay in Democratic areas. "On the flip side, homeowners in Republican-controlled districts pay lower property taxes — $2,676 on average, compared to $5,127 in Democrat-controlled districts," ATTOM said in a statement. "Republican counties also have fewer homes that have been taken over by lenders in foreclosure proceedings: about 50,000, versus 61,000 in Democratic counties." ATTOM also found that 31% of homeowners with mortgages in Democratic-leaning areas were considered equity-rich, meaning that their homes are worth considerably more than what they owed on their loans. Only 24.3% of owners in Republican-controlled districts were categorized as equity rich. Meanwhile, 7.2% of homeowners in Republican counties are seriously underwater, meaning they owe at least 125% of the value of their properties. In comparison, 4.9% of owners in Democratic counties are seriously underwater. 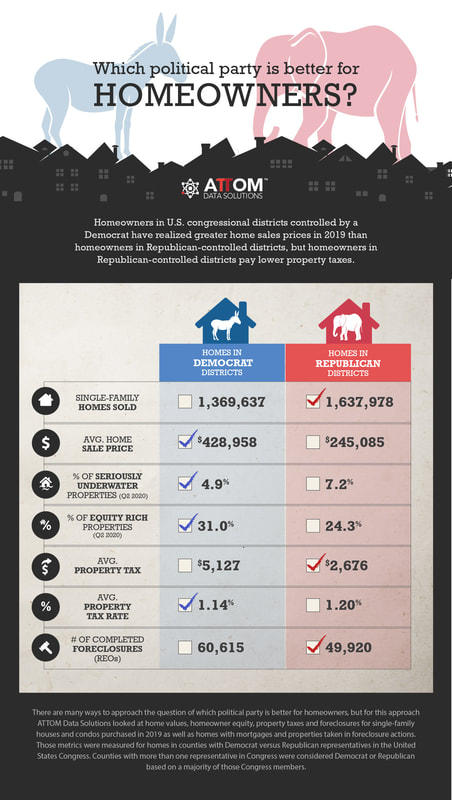 |
|

- iMove Chicago
- Real Estate School
-
Laws
-
CRLTO
>
- 5-12-010 Title, Purpose And Scope.
- 5-12-020 Exclusions.
- 5-12-030 Definitions.
- 5-12-040 Tenant Responsibilities.
- 5-12-050 Landlord’s Right Of Access.
- 5-12-060 Remedies For Improper Denial Of Access.
- 5-12-070 Landlord’s Responsibility To Maintain.
- 5-12-080 Security Deposits.
- 5-12-081 Interest Rate On Security Deposits.
- 5-12-082 Interest Rate Notification.
- 5-12-090 Identification Of Owner And Agents.
- 5-12-095 Tenants’ Notification of Foreclosure Action.
- 5-12-100 Notice Of Conditions Affecting Habitability.
- 5-12-110 Tenant Remedies.
- 5-12-120 Subleases.
- 5-12-130 Landlord Remedies.
- 5-12-140 Rental Agreement.
- 5-12-150 Prohibition On Retaliatory Conduct By Landlord.
- 5-12-160 Prohibition On Interruption Of Tenant Occupancy By Landlord.
- 5-12-170 Summary Of Ordinance Attached To Rental Agreement.
- 5-12-180 Attorney’s Fees.
- 5-12-190 Rights And Remedies Under Other Laws.
- 5-12-200 Severability.
- Illinois Eviction Law (Forcible Entry And Detainer)
- Illinois Security Deposit Return Act
-
CRLTO
>
- Today's Cool Thing
- Social Media

